
Have you ever found yourself staring at all the student progress data you’ve collected? Insights and patterns are there for the finding, but it takes time and energy to really make sense of student data across multiple platforms, binders, or gradebooks to inform your instruction.
Keep reading for easy strategies to make sense of data in your classroom this week!
Why classroom data matters more than ever
You’re gathering more information about your students than ever—exit tickets, fluency checks, digital reports, observations, and assessments. But without a plan for using that information, classroom data becomes a stack of numbers instead of a tool you can rely on to improve learning.
The “so what” of data-driven instruction
RAND research shows that data-driven instruction matters most when it helps you make real instructional decisions—identifying what your students understand, where they need support, and how you can take action based on data. True data-driven instruction and data-driven decision-making in education go far beyond collecting numbers. The data you gather has to be actionable so you can connect what you see to what you do next.
5 strategies to actually use your classroom data
To turn dashboards and assessment results into meaningful teaching decisions, you need routines that make it easy to use your data in the classroom. Check out these five practical classroom data strategies you can start using right away.
1. Start with a clear goal
Before you look at any data, decide what you want to learn from the numbers. Are you checking for math fact fluency gaps? Trying to see how students performed on a specific fractions standard? Looking for who needs small-group support? When you start with a clear purpose, you know exactly which data matters (and which data you can ignore). Effective classroom data strategies always begin with intention.
2. Use student-friendly tools
Your students can (and should!) take part in understanding their growth. A simple student data tracker helps students reflect on progress, set goals, and connect their effort to improvement. When students track their own learning, you build a classroom culture of ownership, accountability, and confidence.
Game-based programs like Reflex (for math fact fluency) and Frax (for fractions) include offline resources that help students monitor and celebrate their growth. Discover student Reflex Green Light trackers and themed monthly data trackers. For fractions, try Frax and check out the pre-made student monitoring resources to motivate your students as they track their growth.
3. Reflect on class trends
Once you look at individual progress, zoom out to see the bigger classroom picture. Are several students struggling with the same skill or standard? Did a new approach help most of the class? Do you need to reteach, regroup, or move on? When you recognize trends, you can adjust pacing, refine small-group lessons, or reinforce skills the whole class needs.
4. Monitor progress in real time
Data is most useful when it’s timely and easy to interpret. Math tools like Reflex and Frax include reporting tools that provide clear insights to monitor progress, track student usage patterns, and receive alerts when students may need extra support. As math intervention tools, they help you act early, before gaps widen.
5. Share and celebrate growth
Your students deserve to see how far they’ve come! Share their progress and celebrate milestones, both big and small. Create a quick bulletin board in your classroom or hallway to track progress and shout-out successes. Loop in families with progress updates and personal student wins to build a strong support system and increase student motivation.
Reflex empowers students to track their own math fact fluency progress and growth from the very start of each practice session, putting recent success front and center. With a clear view of fact fluency growth, Green Light activity from the past seven days, competition involvement, and instant celebration when they earn a Green Light, students can recognize their effort, stay motivated, and build confidence through consistent practice.
.webp)
Students see their personal Green Light streaks and math fact fluency growth in Reflex.
How Reflex and Frax make data actionable
Reflex and Frax give you data you can actually use, rather than reports that sit forgotten in a binder. Individual and group reports provide insights to make data-driven instruction simple and meaningful. You get immediate insight into what your students need next, so you can plan with confidence, differentiate more easily, and help every learner move forward.
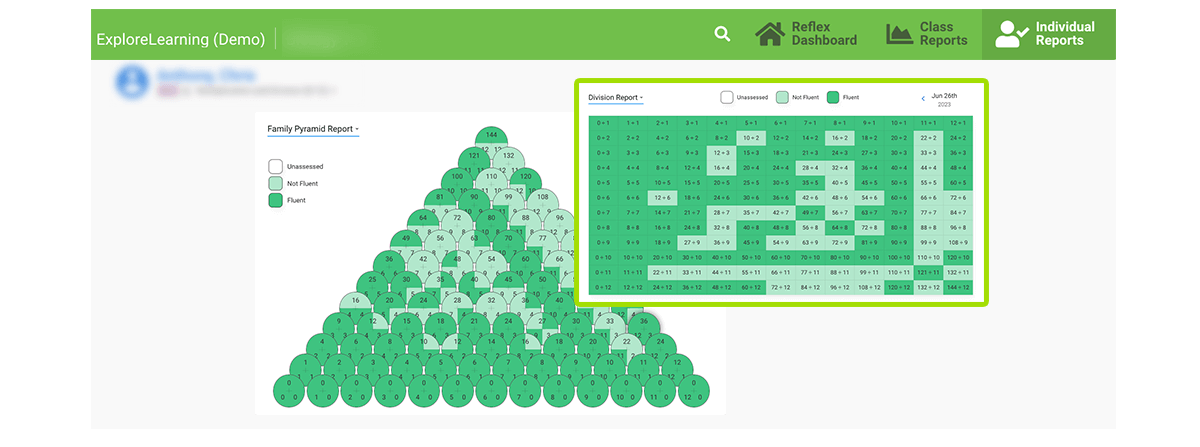
For example, in Reflex, you can review the Individual Fact Detail Report for each student to determine what math facts a student is fluent in and which ones still need practice.
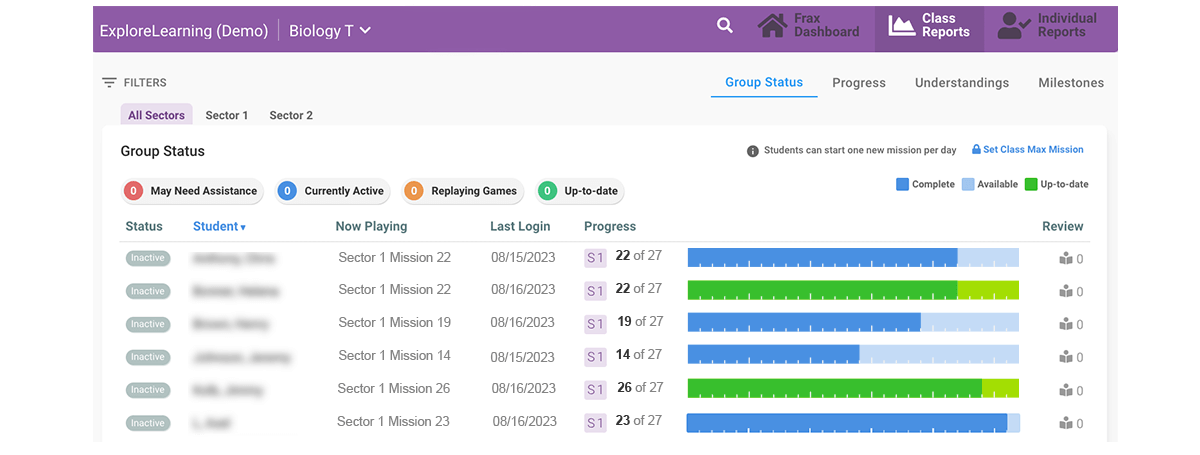
With Frax, the Group Status Report allows you to monitor students' progress as they work in Frax. Each student has a circle indicating whether they are active, struggling, or inactive. When the student has completed all available missions for the day, the sector progress bar turns green with a checkmark to indicate that the student is “up-to-date.”
Are you ready for data-driven math instruction with built-in progress monitoring tools that make taking action easy? Get started with a free classroom trial today.